DASCH was the project to digitize the Harvard College Observatory’s Astronomical Photographic Glass Plate Collection for scientific applications. The legacy of this herculean undertaking is DASCH Data Release 7, an extraordinary dataset that enables scientific study of the whole sky on 100-year timescales.
Scientific Goals
DASCH sought to enable new “time-domain astronomy” (TDA) science by producing lightcurves with ~0.1 mag uncertainties over ~100 year time scales. Research areas benefiting from such a dataset include:
- Conduct the first long-term temporal variability survey on days to decades time scales
- Novae and dwarf novae distributions and populations in the Galaxy
- Black hole and neutron star X-ray binaries in outburst: constraining the BH, NS binary populations in the Galaxy
- Black hole masses of bright Quasars from long-term variability measures to constrain their characteristic shortest timescales and thus size
- Quiescent black holes in galactic nuclei revealed by tidal disruption of a passing field star and resultant optical flare
- Unexpected classes of variables or temporal behavior of known objects: preview of what surveys like LSST may see in much more detail (but on shorter timescales)
Enabled by the DASCH scanner
DASCH’s custom-designed scanner could scan two 8×10 inch plates or one 14×17 inch plate into 11 micron pixels in only ~80 sec, allowing around 400 plates to be digitized every day. See the scanner page for more information about this one-of-a-kind device.
Precision Photometry
The data from this scanner are calibrated by a highly-refined data pipeline that can handle the unusual and highly diverse imagery produced by the scanner. See the pipeline overview page for an overview of the analysis pipeline.
Project Milestones
See the project news page for additional updates.
2024 December 29: Data Release 7, the DASCH legacy data release, is completed.
2024 October 15: A complete astrometric and photometric reprocessing of the DASCH data, underway since the completion of scanning, finishes.
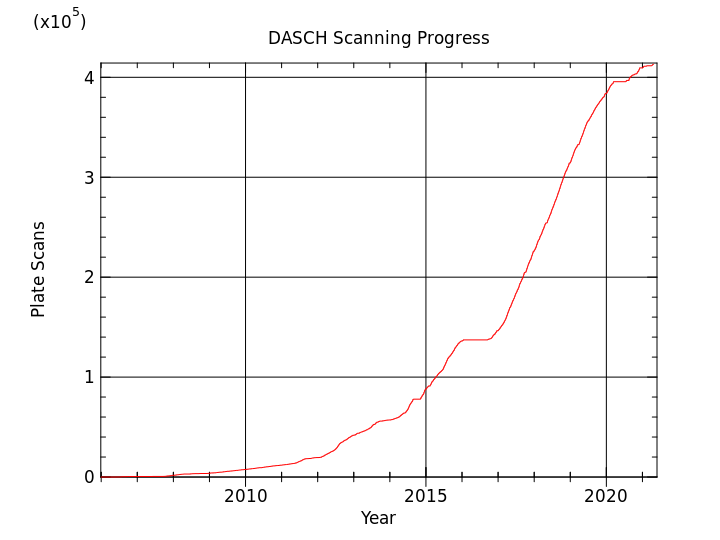
2024 March 28: DASCH scanning completes. A total of 435,763 plates were scanned.
2023 November 9: Scanning resumes after a technical overhaul in the wake of the April 2021 database crash.
2023 August 23: Culminating a six-month process, the final backup tape of raw DASCH scan data is duplicated onto Amazon AWS’s Glacier Deep Storage system, providing a new disaster recovery failsafe.
2021 January 1: The 410,000th plate is scanned.
2020 July 16: Scanning resumes after shutting down on March 13 because of the COVID-19 pandemic.
2019 May 30: The 350,000th plate is scanned.
2019 January 31: DASCH Data Release 6 is released.
~2019: The imaging department at the Widener library brings the total of logbook images to 81,646 pages from 842 logbooks. Volunteers locally, at the American Museum of Natural History in New York City, the Astronomical League, and the Smithsonian help us transcribe these images. When combined with previous work to transcribe the card catalog and experiments with commercial transcriptions, we now have plate centers for 549,797 exposures.
2018 October 24: The 300,000th plate is scanned.
2018 May 31: DASCH’s APASS calibration updates to incorporate proper motions from the UCAC5 catalog, rather than UCAC4.
2017 September 7: The 200,000th plate is scanned.
2016 September 16: Scanning resumes after recovery from a flood.
2016 August 9: DASCH Data Release 5 is released.
2015 April 7: The 100,000th plate is scanned.
2014 December: Release 8 of the APASS Catalog becomes available. At the start of the project, the best available catalog was the Hubble Guide Star Catalog Version 2.3.2. APASS provided us with a new source of calibration stars in the magnitude range of our plates. From 346,206 plates we have 23,308,000,000 magnitudes and match 247,747,000 stars from the combined APASS, GSC2.3.2, and Tycho-2 catalogs to generate over 49,758,000 lightcurves with at least two good points. The combined catalog allows matching with stars missing from the APASS catalog, but for best accuracy, magnitude calibration uses only APASS magnitudes.
2014 November 13: We scanned our 80,000th plate following a shutdown to repair and upgrade the plate loader mechanism and control box.
2014 June 23: DASCH Data Release 3 is released.
2013 November 20: DASCH Data Release 2 is released.
2013 May 2: DASCH Data Release 1 is released.
2012 September 14: We begin backing up all of the raw tile and calibration data to LTO-5 magnetic tapes.
2012 January 26: The 20,000th plate is scanned. In the runup to this milestone, we completed scanning our first batch of the large 8"×14" “A” series plates. These plate scans produce two-gigabyte mosaics. This switch from the 8"×10" plates which make up the bulk of the collection required a number of procedural changes and slowed the scanning rate by nearly a factor of three. The 20,000th scan was completed after switching back to 8"×10" plates to scan some candidate stars in Scorpio.
2011 May 19: We complete the move of our photometry pipeline to three nodes on Harvard’s Odyssey cluster (now known as Cannon).
2011 April: DASCH begins calibrating with the APASS catalog, which offers accurate magnitudes in a brightness range which is a good match to our plate collection.
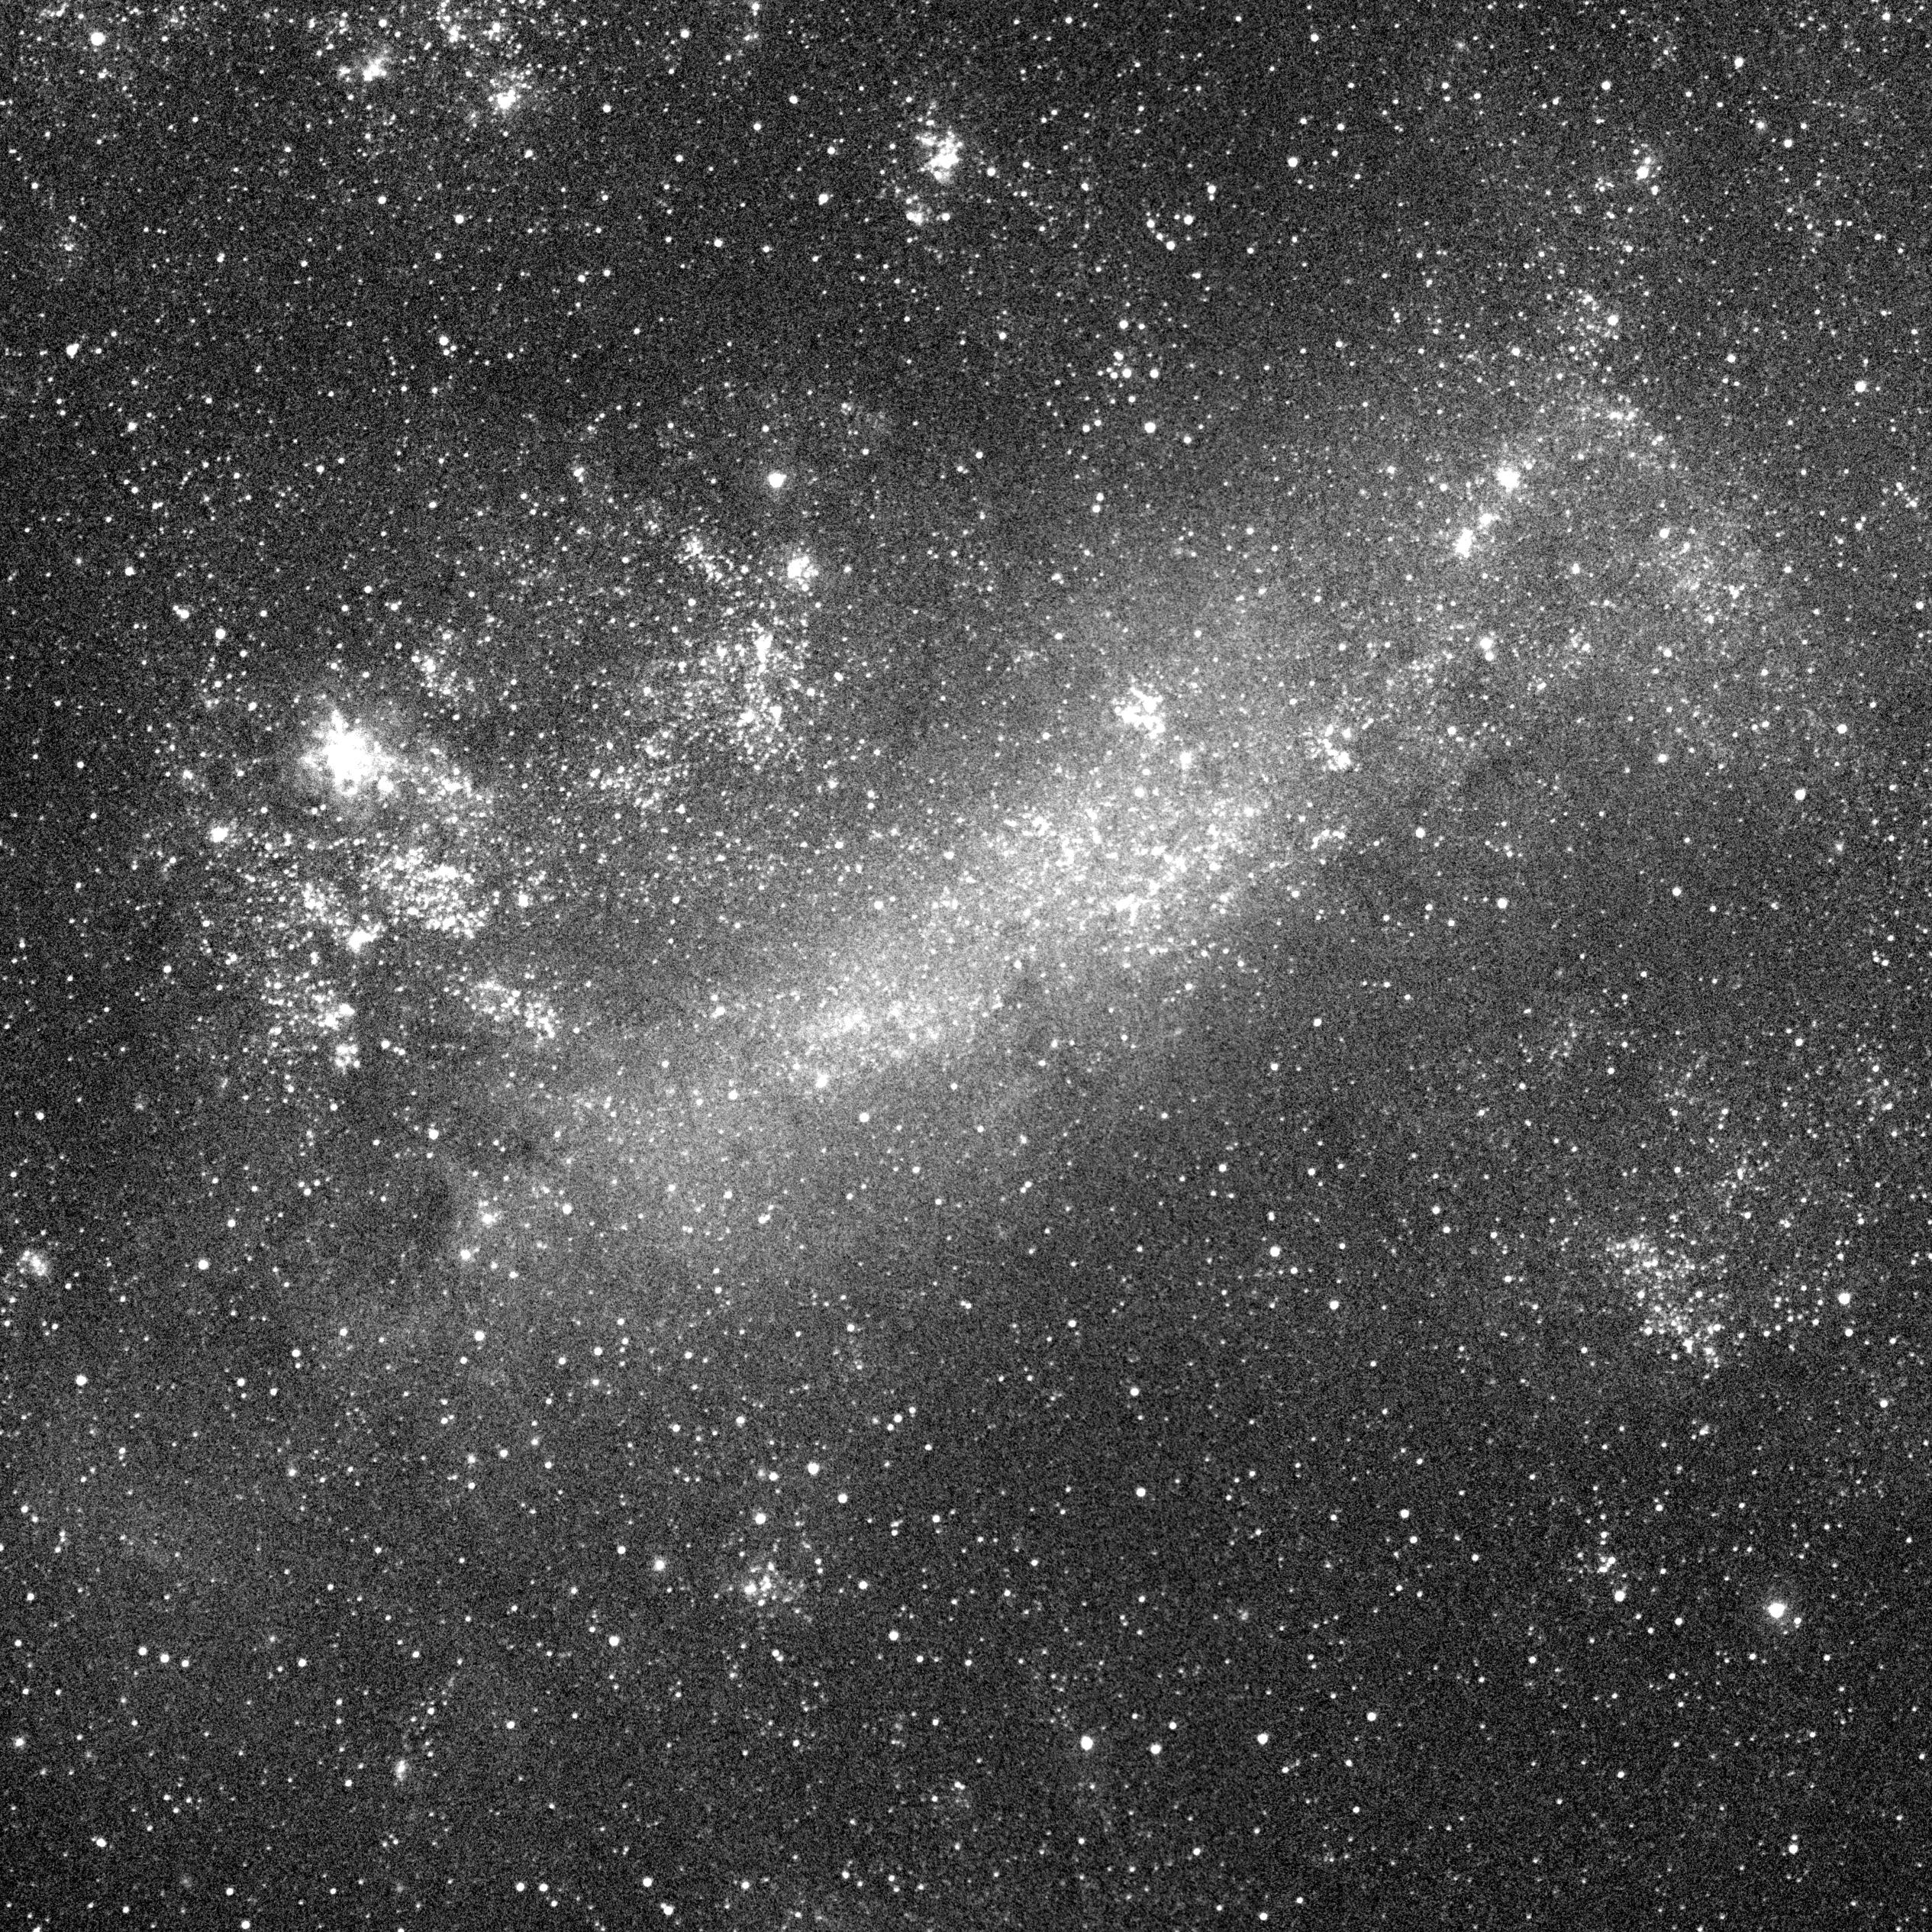
2010 July 8: The 10,000th plate is scanned as part of an effort to cover the Large Magellanic Cloud. The image on the left was extracted from plate DSB00978 taken from Mt. John, New Zealand with the 0.042 m Damon South Blue patrol telescope on December 8, 1982 using a 30 minute exposure. In September, we took time out from the LMC project to fill in our coverage for the Baade's window and to scan plates of Tc 1, a planetary nebula in which C60 and C70 fullerines have recently been detected. We also took time out to scan plates for interesting stars discovered with Sumin Tang's data mining algorithms.
2010 June: A new air conditioning system is installed, making it so that the temperature of the scanner electronics can remain stable over the course of long scanning sessions.
2010 February: A bardcode scanning system is introduced to reduce the need for manual data entry, improving the tracking of plates.
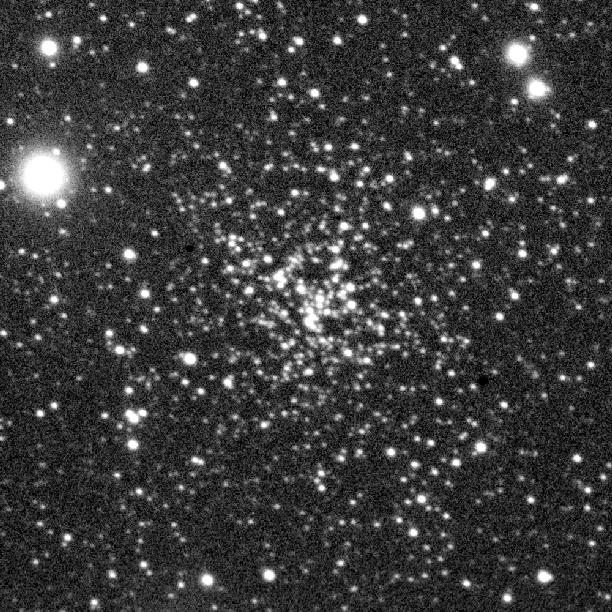
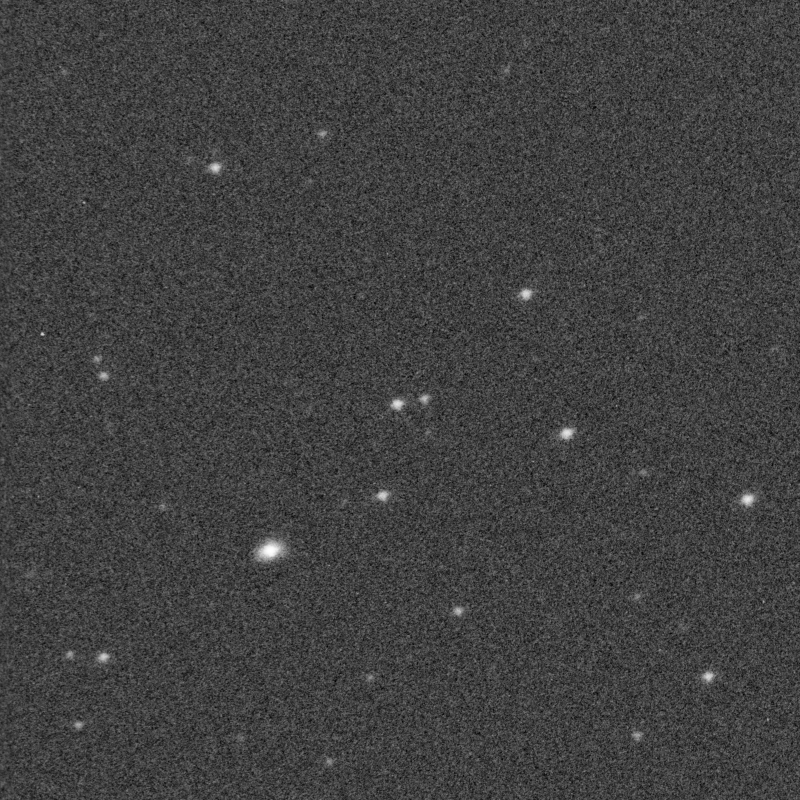
2009 Apr 23: The 5,000th plate is scanned. We completed scanning the field of view region of the Kepler satellite. The image on the left is NGC6819 which is one of the more prominent clusters in the Kepler field. This image comes from plate MC36426 taken with the 16-inch Metcalf Doublet at Harvard, Massachusetts with a 60-minute exposure on July 4, 1949. Thanks to Dave Latham, we are using the Kepler Input Catalog to refine the colorterm processing of our photometry pipeline. From 9,011 Kepler field plates, we have 731,512,000 magnitudes and 1,408,000 lightcurves with at least two good points from the 4,678,000 stars matched to the Kepler Input Catalog. The more accurate photometry in this catalog has simplified our task of identifying unusual stars.
2009 January 8: The 4,000th plate is scanned as part of a project that involves scanning plates for the quasars PG0844+349, PG2130+099 and PG1211+143.
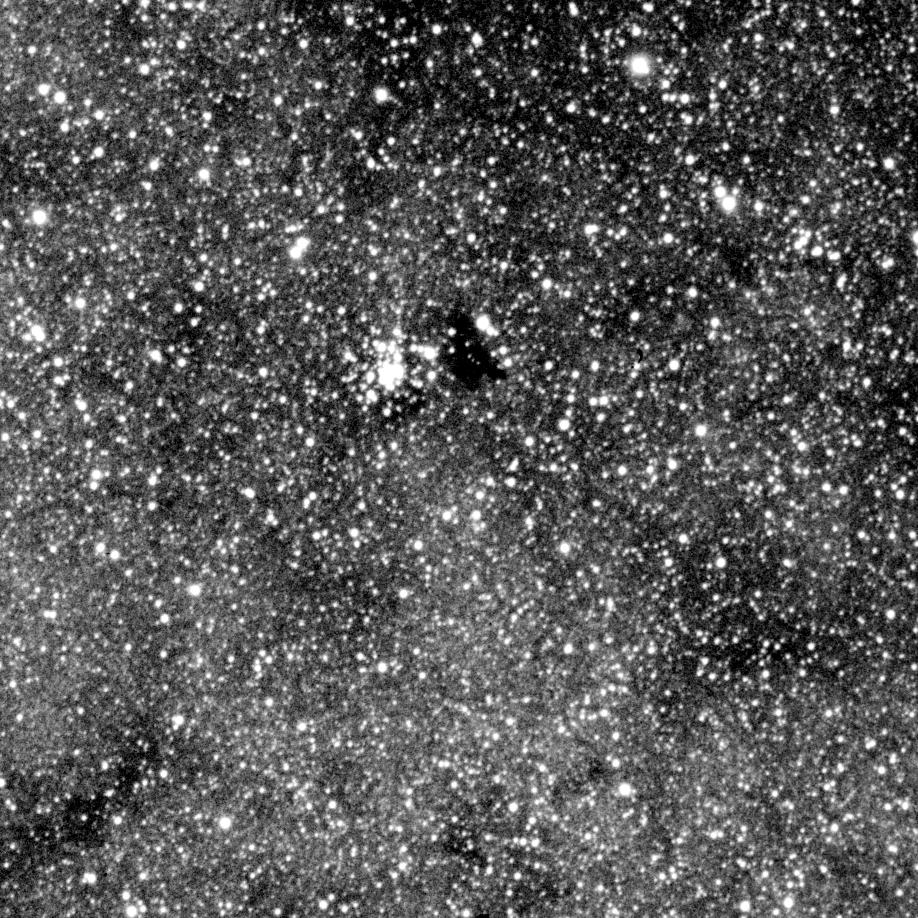
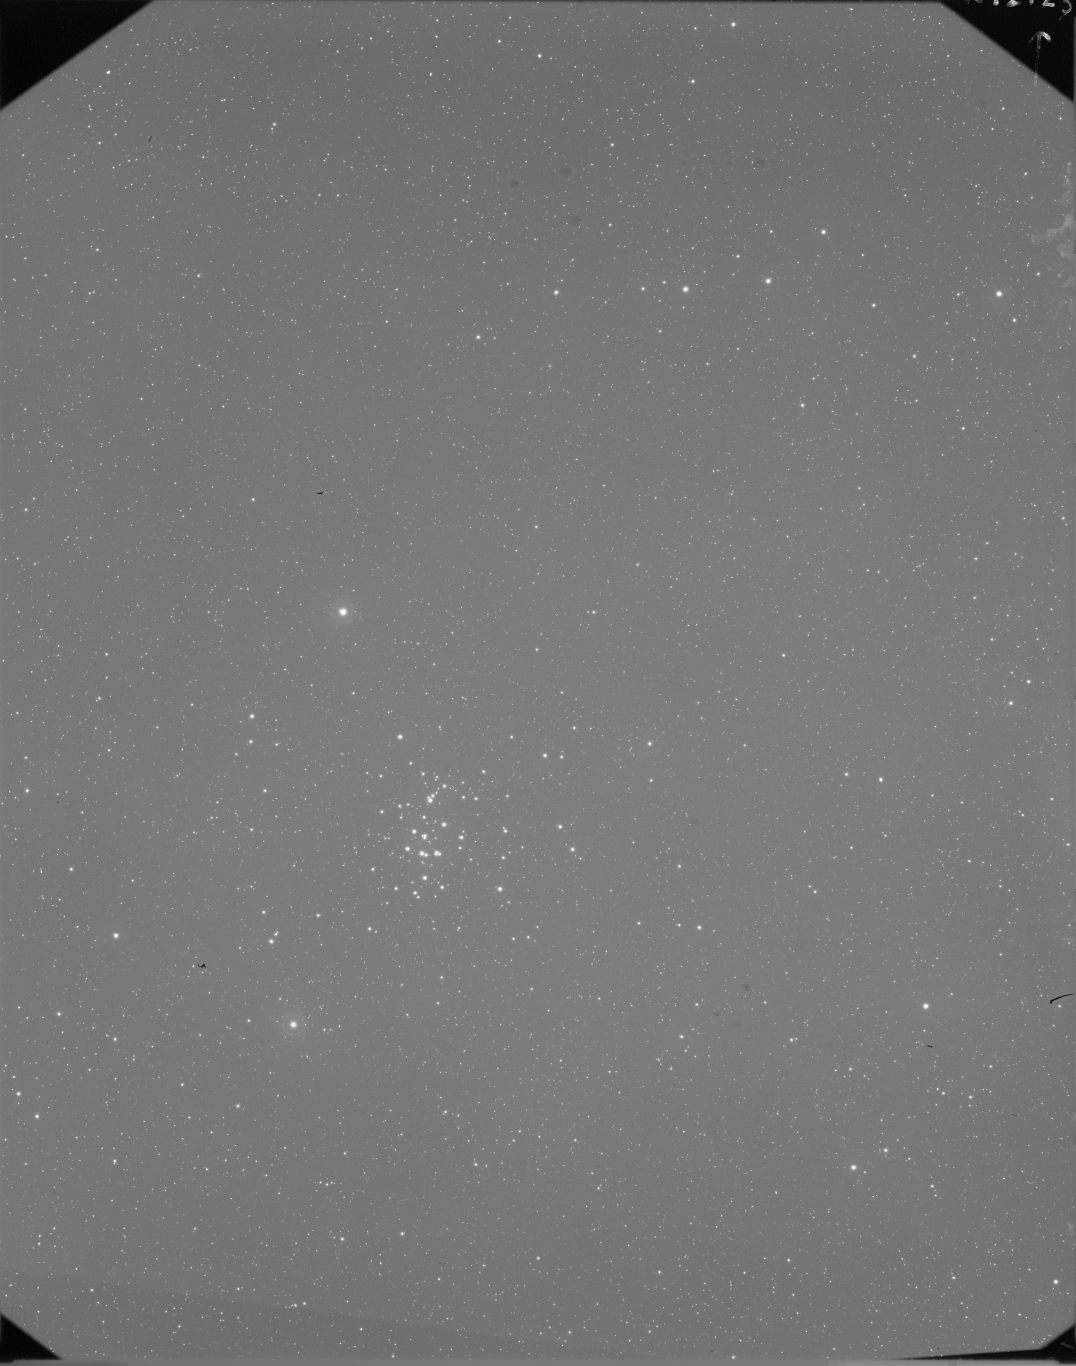
2008 February 28: The 2,500th plate is scanned as part of a set of 868 plates covering the region of Baade's window, where we are testing our photometry pipeline. This is one of the densest star fields in the Milky Way and we hope to obtain rates of novae and other burst phenomena near the center of our galaxy. The cluster NGC6520 is near the center of this image extracted from plate RB16468 taken on August 28, 1949 from Bloemfontein with a two hour exposure using the 3 inch Ross Fecker.
2007 October 25: The 1,000th plate is scanned during a campaign to digitize a set of 1,413 plates covering 3C273, part of a project to improve the existing long-term photometry of this quasar. The 3C273 quasar is at the center peak of the "w" asterism in this extract from plate MF16956 taken on June 23, 1932 from Bloemfontein with a 45 minute exposure using the 10 inch Metcalf Triplet.
2007 May: the late George Champine completes imaging 79,470 pages from 813 logbooks and unbound sheets. This metadata is essential to understanding the scanned imagery.
2006 October 26: The initial set of approximately 600 scans was concentrated in the region of the sky around M44 because the photometry of this cluster is well known. The results are used to develop the photometric pipeline. This image is of plate IR12723 of M44 taken on February 15, 1974 from Oak Ridge with the 8-inch Ross Lundin. The exposure was 15 minutes centered on 08h36m07s R.A. and +20h51m57s declination.
2006 September 8: The 500th plate is scanned: I35197.
2006 June 20: The 100th plate is scanned: RH00758.
2005 December 27: The 10th plate is scanned: MC05719.
2005 November 21: The first plate is scanned with the full scanner system. It is D11023, a positive copy of plate A03690. It captures the Rho Ophiucus complex and the original was taken on July 8, 1899 at Arequipa, Peru.
2005 July 26: The official DASCH first-light exposure is made. The camera captured part of plate C12144, which was taken on September 4, 1899 with the 11 inch Draper Refractor in Cambridge. A temporary support positioned the plate for this exposure.
2005 May 31: The linear stage of the DASCH scanner is delivered to Harvard.
2005 February 24: The first image of a plate is taken using a new LED strobe system. The final illumination source is composed of four Lamina Ceramics red LED arrays containing 117 LED's per array or 468 total. The LED arrays are strobed with a 5 amp power supply generating about 120W of power. Typical exposure times are 6 to 50 msec.
2005 February 1: First light from the DASCH camera. The camera was tested with a single LED while a sufficiently bright illumination source was being developed. As the camera had no shutter, the image was smeared as it clocked out of the camera. It also contained a gap in the center, which was eventually closed by adjusting the parameters of the Coreco dual channel frame grabber which receives the image from the CameraLink camera interface and transfers it to host memory.
A Team Effort
See also the DASCH Team page to learn about the people behind the DASCH project, or the Acknowledgments page for information about the supporters that made DASCH possible.